Highlights
Below is a selected list of highlights generated for VTK-m related R&D.
|
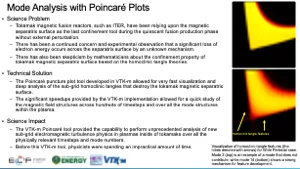
Mode Analysis with Poincaré Plots |
|
|
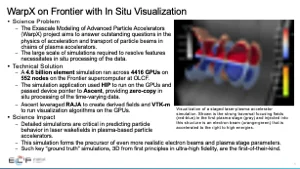
WarpX on Frontier with In Situ Visualization |
|
|
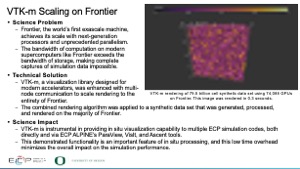
VTK-m Rendering at Scale on Frontier |
|
|
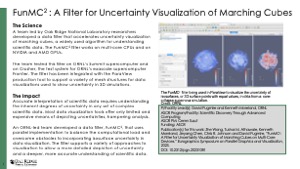
Uncertainty Visualization of Marching Cubes |
|
|
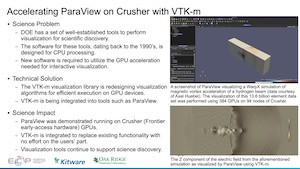
Accelerating ParaView on Crusher |
|
|
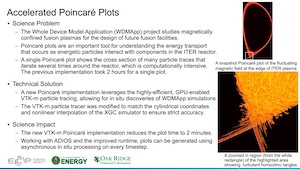
Accelerated Poincaré Plots |
|
|
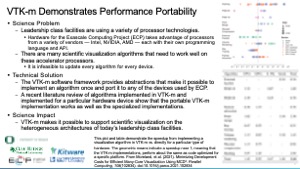
VTK-m Demonstrates Performance Portability |
|
|
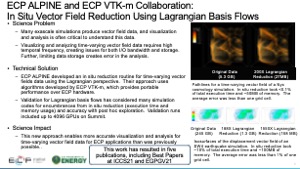
In Situ Vector Field Reduction Using Lagrangian Basis Flows |
|
|
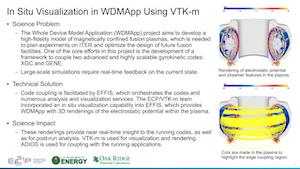
In Situ Visualization in WDMApp Using VTK-m |
|
|
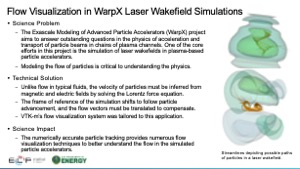
Flow Visualization in WarpX Laser Wakefield Simulations |
|
|
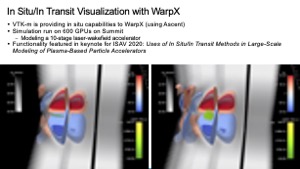
In Situ/In Transit Visualization with WarpX |
|
|
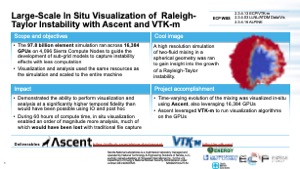
Large-Scale In Situ Visualization of Raleigh-Taylor Instability with Ascent and VTK-m |
|
|
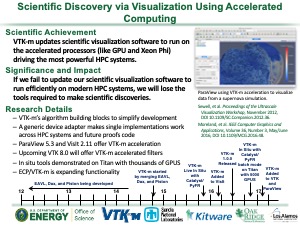
Scientific Discovery via Visualization Using Accelerated Computing |
|
|
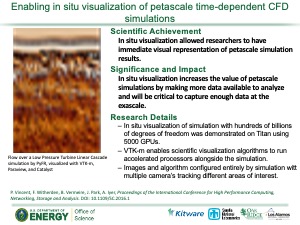
Enabling in situ visualization of petascale time-dependent CFD simulations |
|
|
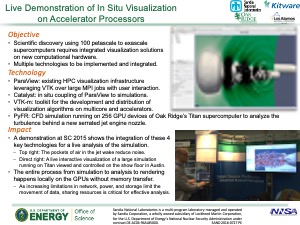
Live Demonstration of In Situ Visualization on Accelerator Processors |
|
Presentations
Here is a list of presentations about VTK-m for your reference.
- Using VTK-m in ParaView and Catalyst at ParaView and Catalyst, CASS Community BOF (June 12, 2024)
- VTK-m Update at DOECGF (April 2024)
- Enabling Visualization at the Exascale with VTK-m at LDAV 2023 Keynote (October 23, 2023) (slides)
- VTK-m: Visualization for the Exascale Era and Beyond at ACM SIGGRAPH Talks (August 2023)
- VTK-m Update at DOECGF (April 2023)
- ECP/VTK-m poster (ECP Annual Meeting, January 2023)
- Performance Portability Pre-ECP and Post-ECP – VTK-m at ECP Annual Meeting (January 2023)
- Lessons Learned from Porting Codes to GPUs – VTK-m at ECP Annual Meeting (January 2023)
- VTK-m Update at DOECGF (August 2022)
- VTK-m: What it is, Why we need it, and How to use it (November 2021) (slides)
- Enabling Visualization on Exascale Accelerators with VTK-m at RAPIDS2-DU Monthly Meeting (July 14, 2021)
- VTK-m Update at DOECGF (April 2021)
- VTK-m Update at DOECGF (April 2020)
- ECP/VTK-m poster (ECP Annual Meeting, February 2020)
- Simulating and Visualizing Turbulent Fluid Mixing using 16,384 GPUs on LLNL’s Sierra Supercomputer as part of panel on VTK-m at scale at DOECGF (April 2019)
- VTKm at Scale: Experiences from a Recent In Situ Research Project as part of panel on VTK-m at scale at DOECGF (April 2019)
- VTK-m Update at DOECGF (April 2019)
- VTK-m: Lessons from Building a Visualization Toolkit for Massively Threaded Architectures (NVIDIA - GTC, March 20, 2019)
- Brief tutorial at ECP Annual Meeting (January 2019)
- ECP/VTK-m poster (ECP Annual Meeting, January 2019)
- VTK-m Update at DOECGF (April 2018)
- Data Analysis and Visualization Mini-Symposium (February 2018)
- Brief tutorial at ECP Annual Meeting (February 2018)
- Presentation at Kitware Booth, SC17 (November 2017)
- Intel HPC Developer Conference VTK-m Status Update
- VTK-m Highlight Prepared for SDAV
- ECP/VTK-m poster (ECP Annual Meeting, January 2017)
- DOE Visualization Software (ECP Annual Meeting, January 2017)
- VTK-m: Accelerating the Visualization Toolkit for Massively Threaded Architectures (IEEE VIS, October 27, 2016)
- VTK-m: Accelerating the Visualization Toolkit for Massively Threaded Architectures, DOECGF 2016
- Adapting the Visualization Toolkit for Many-Core Processors with the VTK-m Library (NVIDIA GTC, - April 6, 2016)
- SC15 Kitware Booth Presentations (November 17-19, 2015)
- VTK-m: Building a Visualization Toolkit for Massively Threaded Architectures (November 16, 2015)
- VTK-m Overview for Intel Design Review (October 12, 2015)
- VTK-m Overview for Code Sprint (September 1, 2015)
- VTK-m poster from SciDAC PI Meeting (July 2015)
- VTK-m (DOECGF, April 29, 2015)
- VTK-m as a many-core solution for DOE (NVIDIA GTC, March 2015)
- VTK-m Overview from VTK-In Situ/Rendering Presentation (NVIDIA GTC , March 2015)
- VTK-m Overview for NVIDIA Design Review (March 5, 2015)
Logos
If you need to reference VTK-m anywhere, you may use our logo for recognition.
| Type | Thumbnail | File types & sizes |
|---|---|---|
|
PNG |
|
|
|
SVG |
|